
TRex Load Generator
- 6 minsThis is the quick blog about how to setup TRex to test your limit. Trex is powerful tool generates L2-7 traffic on pre-processing and smart replay of real traffic templates. Trex can amplifies up to 200Gbps traffic with single server.
For this POC setup i’m using Virtual machine on VMware ESXi.
- VM-1 - 4 vcore / 8GB / 3 virtual nic / Ubuntu 20.04
- VM-2 - 4 vcore / 8GB / 3 virtual nic / ubuntu 20.04
Scope
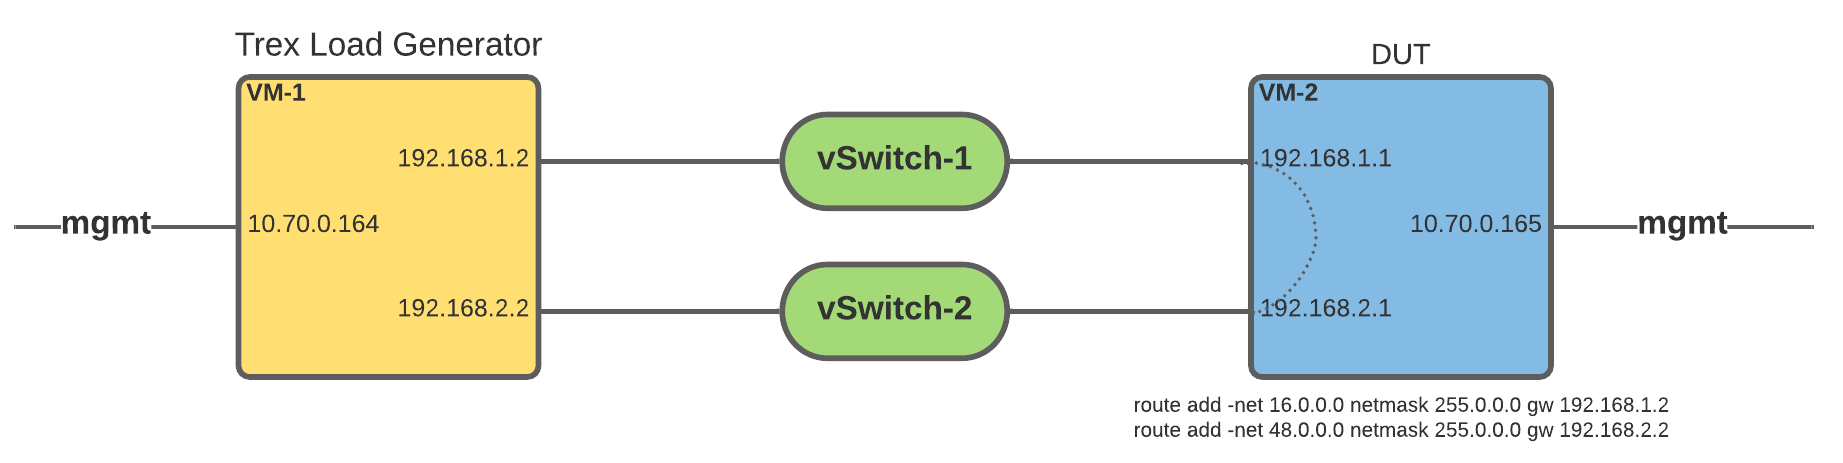
VM-1 and VM-2 connected back-to-back using internal vSwitch to simulate back to back ethernet cable senario, VM-1 is running Trex application and VM-2 is just linux server which will do L3 routing to forward packet from one interface to other.
Setup Trex on VM-1.
Download and install TRex
$ wget --no-check-certificate –no-cache https://trex-tgn.cisco.com/trex/release/latest
$ tar xvzf latest
$ cd v2.93
Check dpdk interface, as you can see ens160 is my mgmt interface for ssh/mgmt and other two are connected to VM-2.
root@vm-1:/opt/trex/v2.93# ./dpdk_setup_ports.py -s

Network devices using DPDK-compatible driver
============================================
<none>

Network devices using kernel driver
===================================
0000:03:00.0 'VMXNET3 Ethernet Controller' if=ens160 drv=vmxnet3 unused=igb_uio,vfio-pci,uio_pci_generic *Active*

Other network devices
=====================
0000:0b:00.0 'VMXNET3 Ethernet Controller' unused=vmxnet3,igb_uio,vfio-pci,uio_pci_generic
0000:13:00.0 'VMXNET3 Ethernet Controller' unused=vmxnet3,igb_uio,vfio-pci,uio_pci_generic
lets configure trex_cfg.yaml file. You can use ./dpdk_setup_ports.py -i option to generate trex_cfg.yaml file in interative mode.
cat /etc/trex_cfg.yaml
### Config file generated by dpdk_setup_ports.py -i ###

- version: 2
  # This is my dpdk interface which i pick from ./dpdk_setup_ports.py -s output
  interfaces: ['0b:00.0', '13:00.0']
  port_info:
      - default_gw: 192.168.1.1 # IP ADDR OF REMOTE DUT MACHINE INTERFACE
        ip:         192.168.1.2 # LOCAL TREX DPDK INTERFACE IP
      - default_gw: 192.168.2.1 # IP ADDR OF REMOTE DUT MACHINE INTERFACE
        ip:         192.168.2.2 # LOCAL TREX DPDK INTERFACE IP

  platform:
      master_thread_id: 0
      latency_thread_id: 1
      dual_if:
        - socket: 0
          threads: [2,3]
Setup DUT on VM-2
Let’s setup DUT (Device Under Test) on vm-2, first configure IP address on two back-to-back connected interfaces.
vm-2$ cat /etc/netplan/00-installer-config.yaml
# This is the network config written by 'subiquity'
network:
  ethernets:
    ens160:
      critical: true
      dhcp-identifier: mac
      dhcp4: no
      addresses: [ 10.70.0.165/21 ]
      gateway4: 10.70.0.1
      nameservers:
        addresses:
        - 8.8.8.8
        search:
        - v1v0x.net
    ens192:
      dhcp4: no
      addresses: [ 192.168.1.1/24 ]
    ens224:
      dhcp4: no
      addresses: [ 192.168.2.1/24 ]
  version: 2
Enable ip_forward
vm-2$ echo "1" > /proc/sys/net/ipv4/ip_forward
Configure routes, Trex emulate clients and servers where it use 16.0.0.0 range for client and 48.0.0.0 for servers. Following routes will send packet according their subnets. In short emulate loopback style senario.
vm-2$ route add -net 16.0.0.0 netmask 255.0.0.0 gw 192.168.1.2
vm-2$ route add -net 48.0.0.0 netmask 255.0.0.0 gw 192.168.2.2
Generate load using TRex
There are two ways you can launch trex application interactive and non-interactive. To launch interactive mode, first you have to launch server mode and then client will connect to it.
Launch server mode
root@vm-2:/opt/trex/v2.93# ./t-rex-64 -i
Now on other terminal connect server using trex-console application.
root@dpdk-1:/opt/trex/v2.93# ./trex-console

Using 'python3' as Python interpeter

Connecting to RPC server on localhost:4501                   [SUCCESS]

Connecting to publisher server on localhost:4500             [SUCCESS]

Acquiring ports [0, 1]:                                      [SUCCESS]

Server Info:

Server version:   v2.93 @ STL
Server mode:      Stateless
Server CPU:       1 x Intel(R) Xeon(R) CPU E5-2680 v3 @ 2.50GHz
Ports count:      2 x 10Gbps @ VMXNET3 Ethernet Controller

-=TRex Console v3.0=-

Type 'help' or '?' for supported actions

trex>
Enable promiscuous mode
trex>portattr -a --prom on

Applying attributes on port(s) [0, 1]:                       [SUCCESS]
Verify ports status
trex>stats --ps
Port Status

     port       |          0           |          1
----------------+----------------------+---------------------
driver          |     net_vmxnet3      |     net_vmxnet3
description     |  VMXNET3 Ethernet C  |  VMXNET3 Ethernet C
link status     |          UP          |          UP
link speed      |       10 Gb/s        |       10 Gb/s
port status     |         IDLE         |         IDLE
promiscuous     |          on          |          on
multicast       |         off          |         off
flow ctrl       |         N/A          |         N/A
vxlan fs        |          -           |          -
--              |                      |
layer mode      |         IPv4         |         IPv4
src IPv4        |     192.168.1.2      |     192.168.2.2
IPv6            |         off          |         off
src MAC         |  00:0c:29:ae:70:dc   |  00:0c:29:ae:70:e6
---             |                      |
Destination     |     192.168.1.1      |     192.168.2.1
ARP Resolution  |  00:0c:29:fe:df:93   |  00:0c:29:fe:df:9d
----            |                      |
VLAN            |          -           |          -
-----           |                      |
PCI Address     |     0000:0b:00.0     |     0000:13:00.0
NUMA Node       |          0           |          0
RX Filter Mode  |    hardware match    |    hardware match
RX Queueing     |         off          |         off
Grat ARP        |  every 120 seconds   |  every 120 seconds
------          |                      |
Launch simple load-test scenario with 100mbps load. You can load traffic as much as you want to test.
trex>start -f stl/udp_1pkt_simple.py -m 100mbps
Start tui to see real-time traffic stats
trex> tui
You can see following countes in tui mode. As you can see port 0 and 1 sending 100.2 Mbps traffic in both direction and you can see pps rate 195Kpps. I would watch drop_rate counter if its non-zero or not because that will tell you about packet drops.
Global Statistics

connection   : localhost, Port 4501                       total_tx_L2  : 200.41 Mbps
version      : STL @ v2.93                                total_tx_L1  : 263.04 Mbps
cpu_util.    : 4.04% @ 1 cores (1 per dual port)          total_rx     : 200.43 Mbps
rx_cpu_util. : 1.61% / 391.46 Kpps                        total_pps    : 391.43 Kpps
async_util.  : 0% / 0.36 bps                              drop_rate    : 0 bps
total_cps.   : 0 cps                                      queue_full   : 0 pkts

Port Statistics

   port    |         0         |         1         |       total
-----------+-------------------+-------------------+------------------
owner      |              root |              root |
link       |                UP |                UP |
state      |      TRANSMITTING |      TRANSMITTING |
speed      |           10 Gb/s |           10 Gb/s |
CPU util.  |             4.04% |             4.04% |
--         |                   |                   |
Tx bps L2  |        100.2 Mbps |       100.21 Mbps |       200.41 Mbps
Tx bps L1  |       131.52 Mbps |       131.52 Mbps |       263.04 Mbps
Tx pps     |       195.71 Kpps |       195.72 Kpps |       391.43 Kpps
Line Util. |            1.32 % |            1.32 % |
---        |                   |                   |
Rx bps     |             0 bps |       200.43 Mbps |       200.43 Mbps
Rx pps     |             0 pps |       391.46 Kpps |       391.46 Kpps
----       |                   |                   |
opackets   |          19019237 |          19019271 |          38038508
ipackets   |                 0 |          37927474 |          37927474
obytes     |        1217231168 |        1217233344 |        2434464512
ibytes     |                 0 |        2427358336 |        2427358336
tx-pkts    |       19.02 Mpkts |       19.02 Mpkts |       38.04 Mpkts
rx-pkts    |            0 pkts |       37.93 Mpkts |       37.93 Mpkts
tx-bytes   |           1.22 GB |           1.22 GB |           2.43 GB
rx-bytes   |               0 B |           2.43 GB |           2.43 GB
-----      |                   |                   |
oerrors    |                 0 |                 0 |                 0
ierrors    |                 0 |                 0 |                 0
To stop load-test run stop command
trex> stop
You can run scenarios in non-interavtive mode also using following example command.
-f
./t-rex-64 -f cap2/dns.yaml -c 1 -m 1 -d 10
Trex comes with many scenarios which you can play. you can browes following directories for more examples
trex/v2.93/stl/
trex/v2.93/astf/
trex/v2.93/emu
trex/v2.93/cap2
Enjoy!!!