
Openstack Central Logging using Opensearch
- 2 minsOpenSearch is a distributed search and analytics engine that supports various use cases, from implementing a search box on a website to analyzing security data for threat detection. The term distributed means that you can run OpenSearch on multiple computers. Search and analytics means that you can search and analyze your data once you ingest it into OpenSearch. No matter your type of data, you can store and analyze it using OpenSearch.
OpenSearch was developed from a relatively advanced fork of Elasticsearch, so all the basic functionality of search, analytics, and dashboards in the two applications are the same.
Prerequisite
- Working openstack cloud (I am using kolla-ansible to deploy openstack cloud)
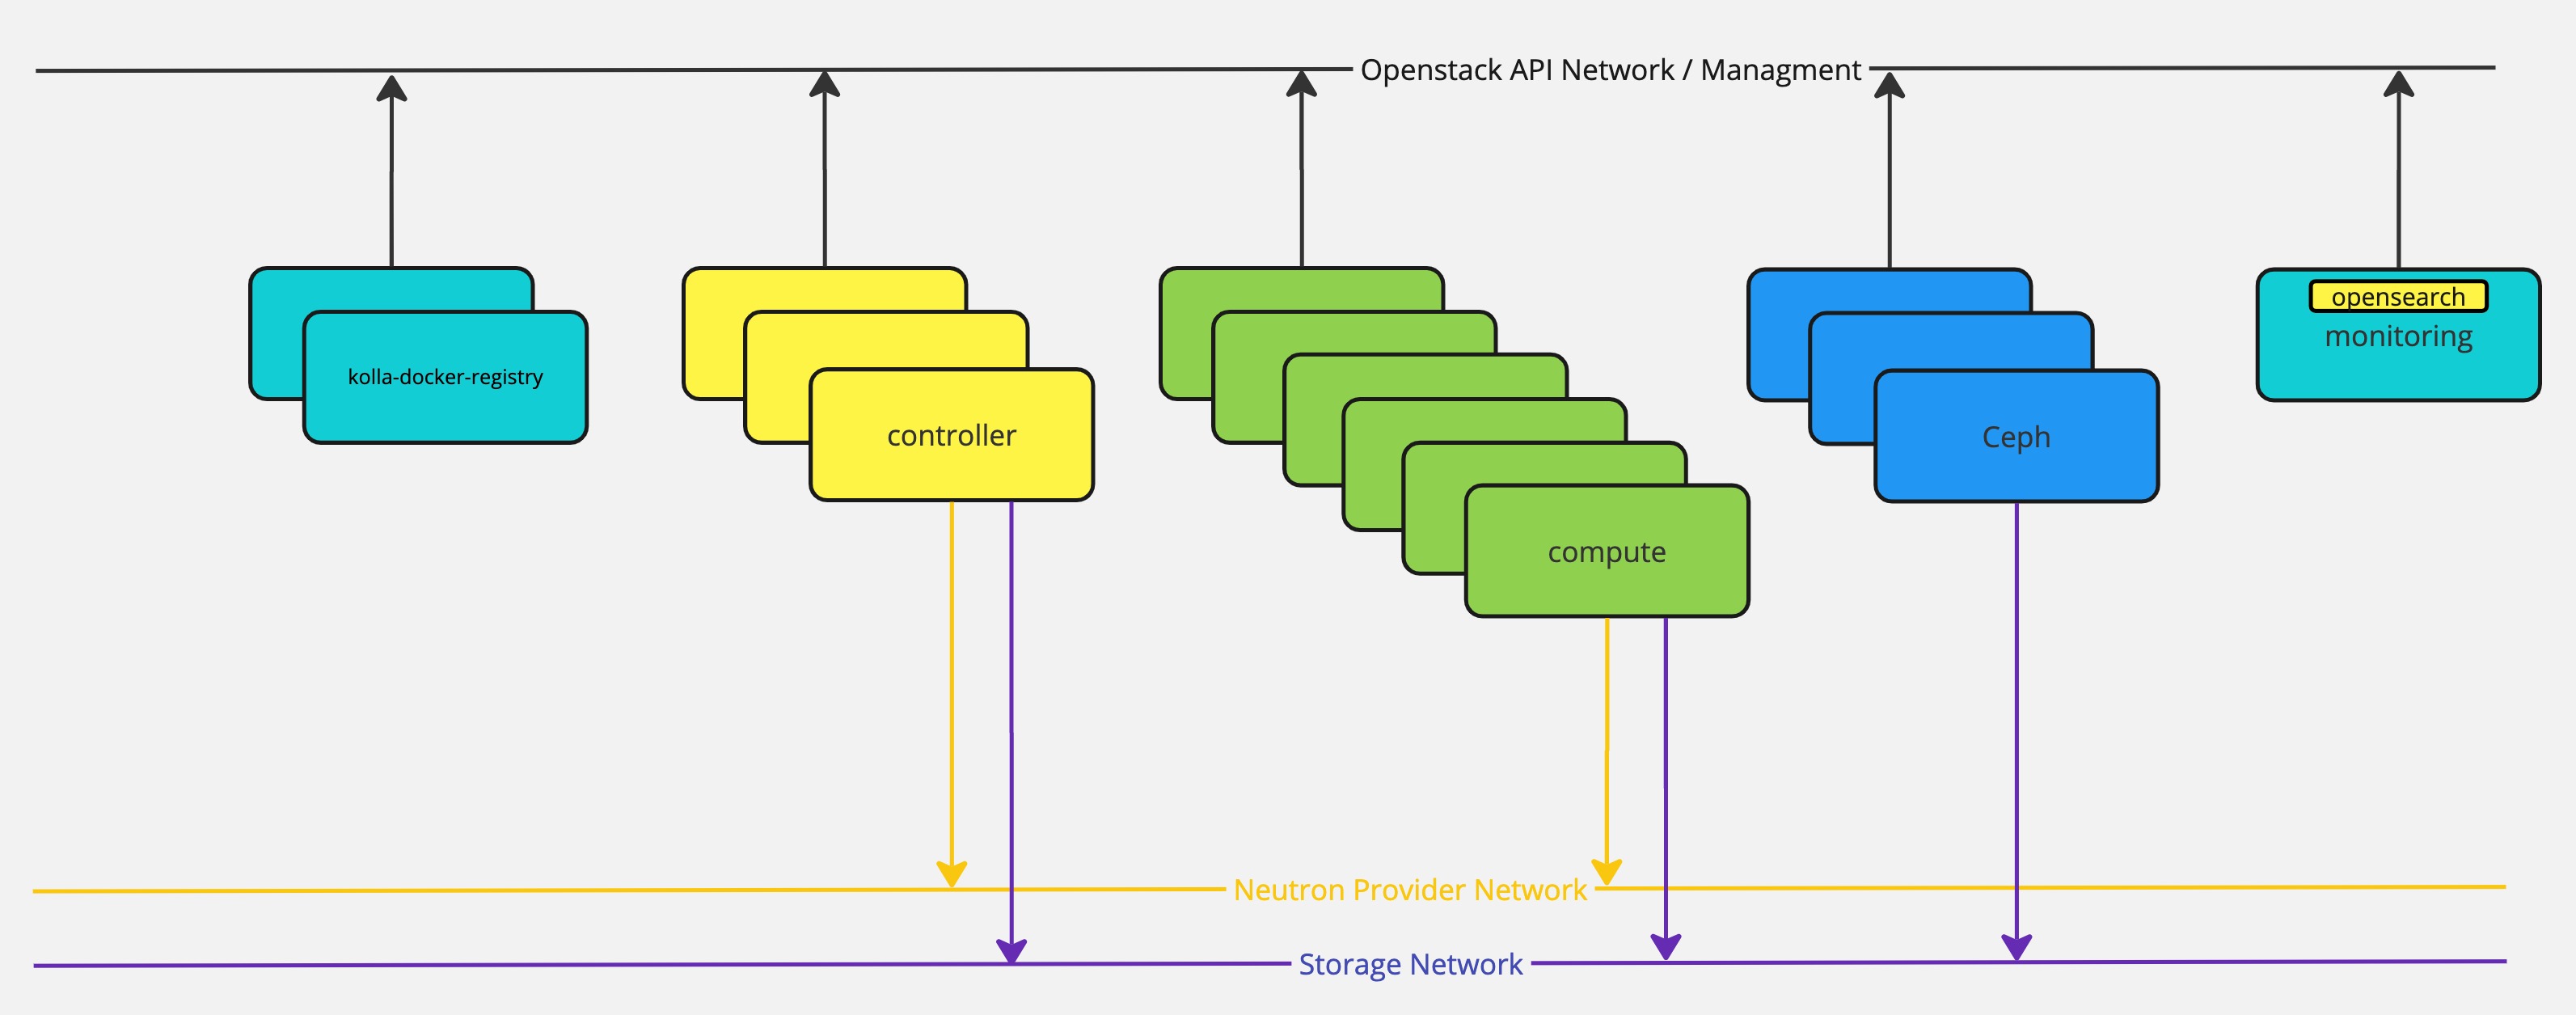
Architecture Diagram
Installation
Modify global.yml to deploy opensearch in kolla-ansible
enable_central_logging: "yes"
Modify inventory file to target monitoring node to deploy opensearch-server and dashboard (By default it will use control nodes to deploy opensearch and that is not a good idea in production)
[monitoring]
os1-bos-mon01

[opensearch:children]
monitoring
Run kolla-ansible to deploy
$ kolla-ansible -i multinode bootstrap-servers --limit os1-bos-mon01
$ kolla-ansible -i multinode deploy --limit os1-bos-mon01
Run haproxy tag to add opensearch service to loadbalancer
$ kolla-ansible -i multinode reconfigure -t haproxy
Run common tag to update fluented config td-agent.conf to point opensearch ipaddr.
$ kolla-ansible -i multinode reconfigure -t common
Validation
If all goes well then you can see two containers running on os1-bos-mon01 host.
root@os1-bos-mon01:~# docker ps | grep opensearch
565a0f4d9ddd   registry.example.com/kolla/opensearch-dashboards:2023.1-ubuntu-jammy   "dumb-init --single-…"   4 days ago   Up 4 days (healthy)             opensearch_dashboards
42f0516ddba2   registry.example.com/kolla/opensearch:2023.1-ubuntu-jammy              "dumb-init --single-…"   4 days ago   Up 4 days (healthy)             opensearch
You can verify opensearch-server to curl 9200 port
root@os1-bos-mon01:~# curl 10.0.28.10:9200
{
  "name" : "10.0.28.9",
  "cluster_name" : "kolla_logging",
  "cluster_uuid" : "h6P6wmTATIix1aPKm5SGnw",
  "version" : {
    "distribution" : "opensearch",
    "number" : "2.11.0",
    "build_type" : "deb",
    "build_hash" : "4dcad6dd1fd45b6bd91f041a041829c8687278fa",
    "build_date" : "2023-10-13T02:57:02.526977318Z",
    "build_snapshot" : false,
    "lucene_version" : "9.7.0",
    "minimum_wire_compatibility_version" : "7.10.0",
    "minimum_index_compatibility_version" : "7.0.0"
  },
  "tagline" : "The OpenSearch Project: https://opensearch.org/"
}
Now go to browser to access opensearch-dashborad using URL http://10.0.28.10:5601
Setup Opensearch
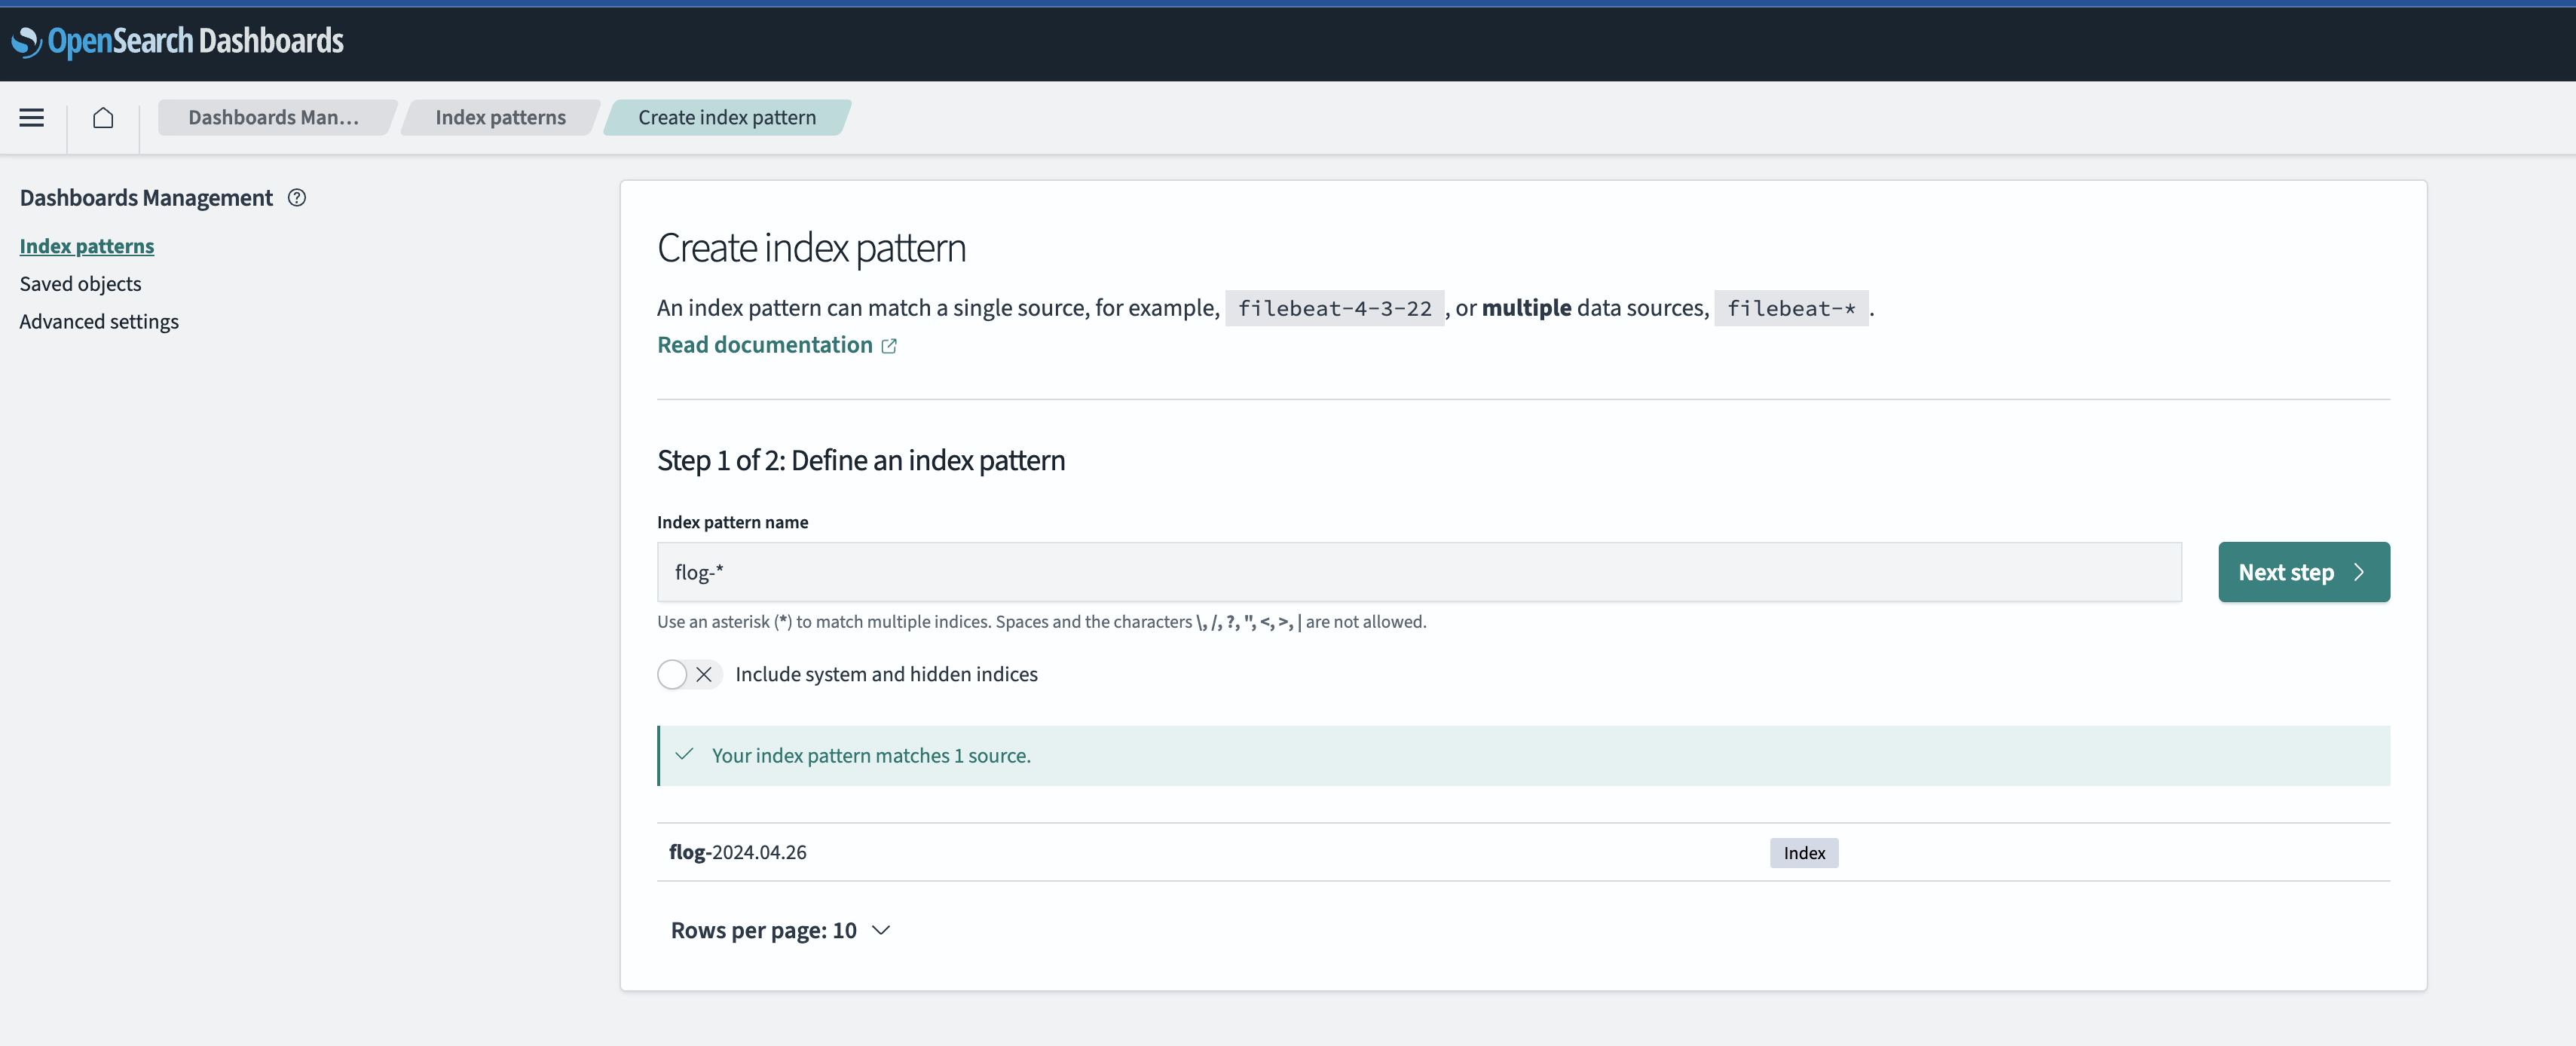
First time you have to create index pattern. (By default kolla-ansible create index name start with flog-* )
Disover
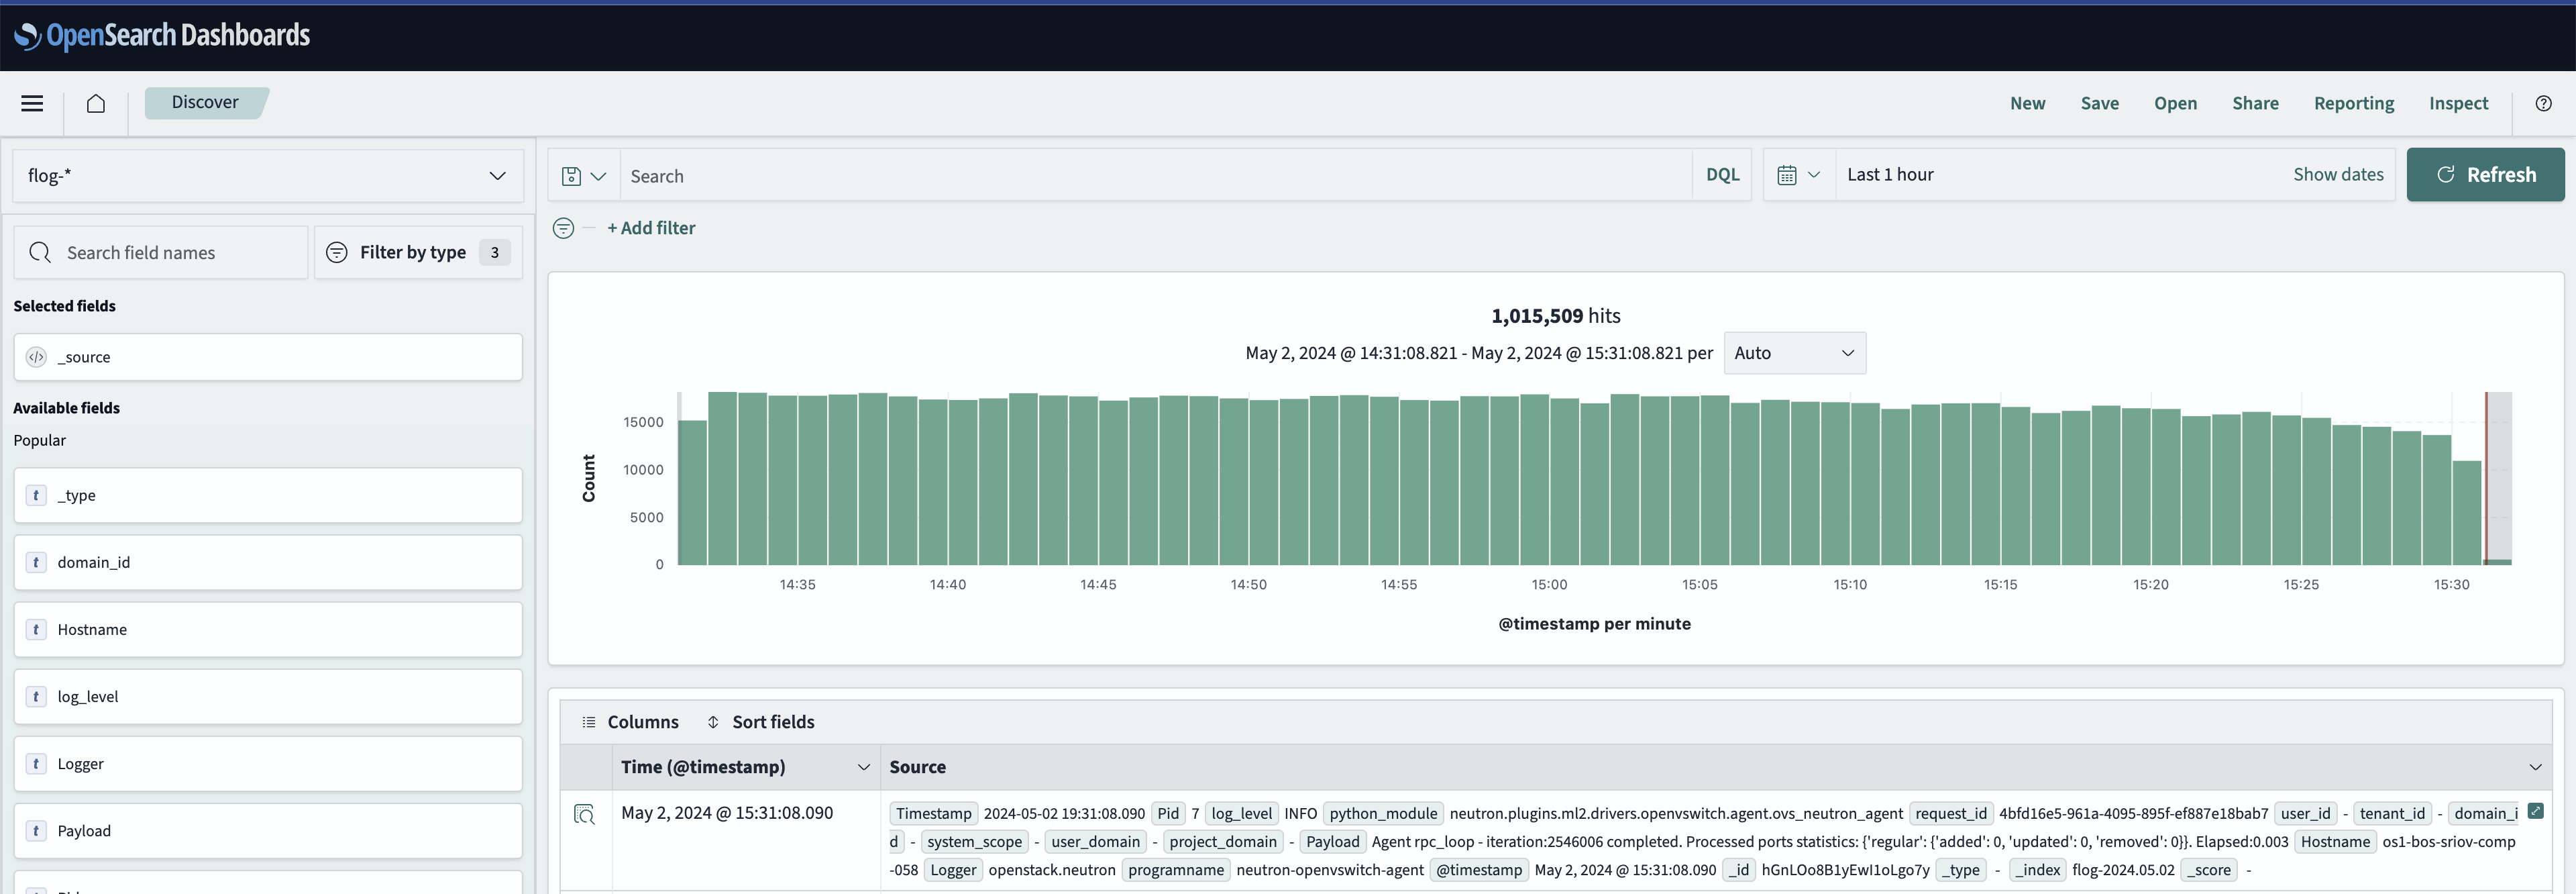
Now you can go to discover tab to search for the logs or logs patterns.
Visualize
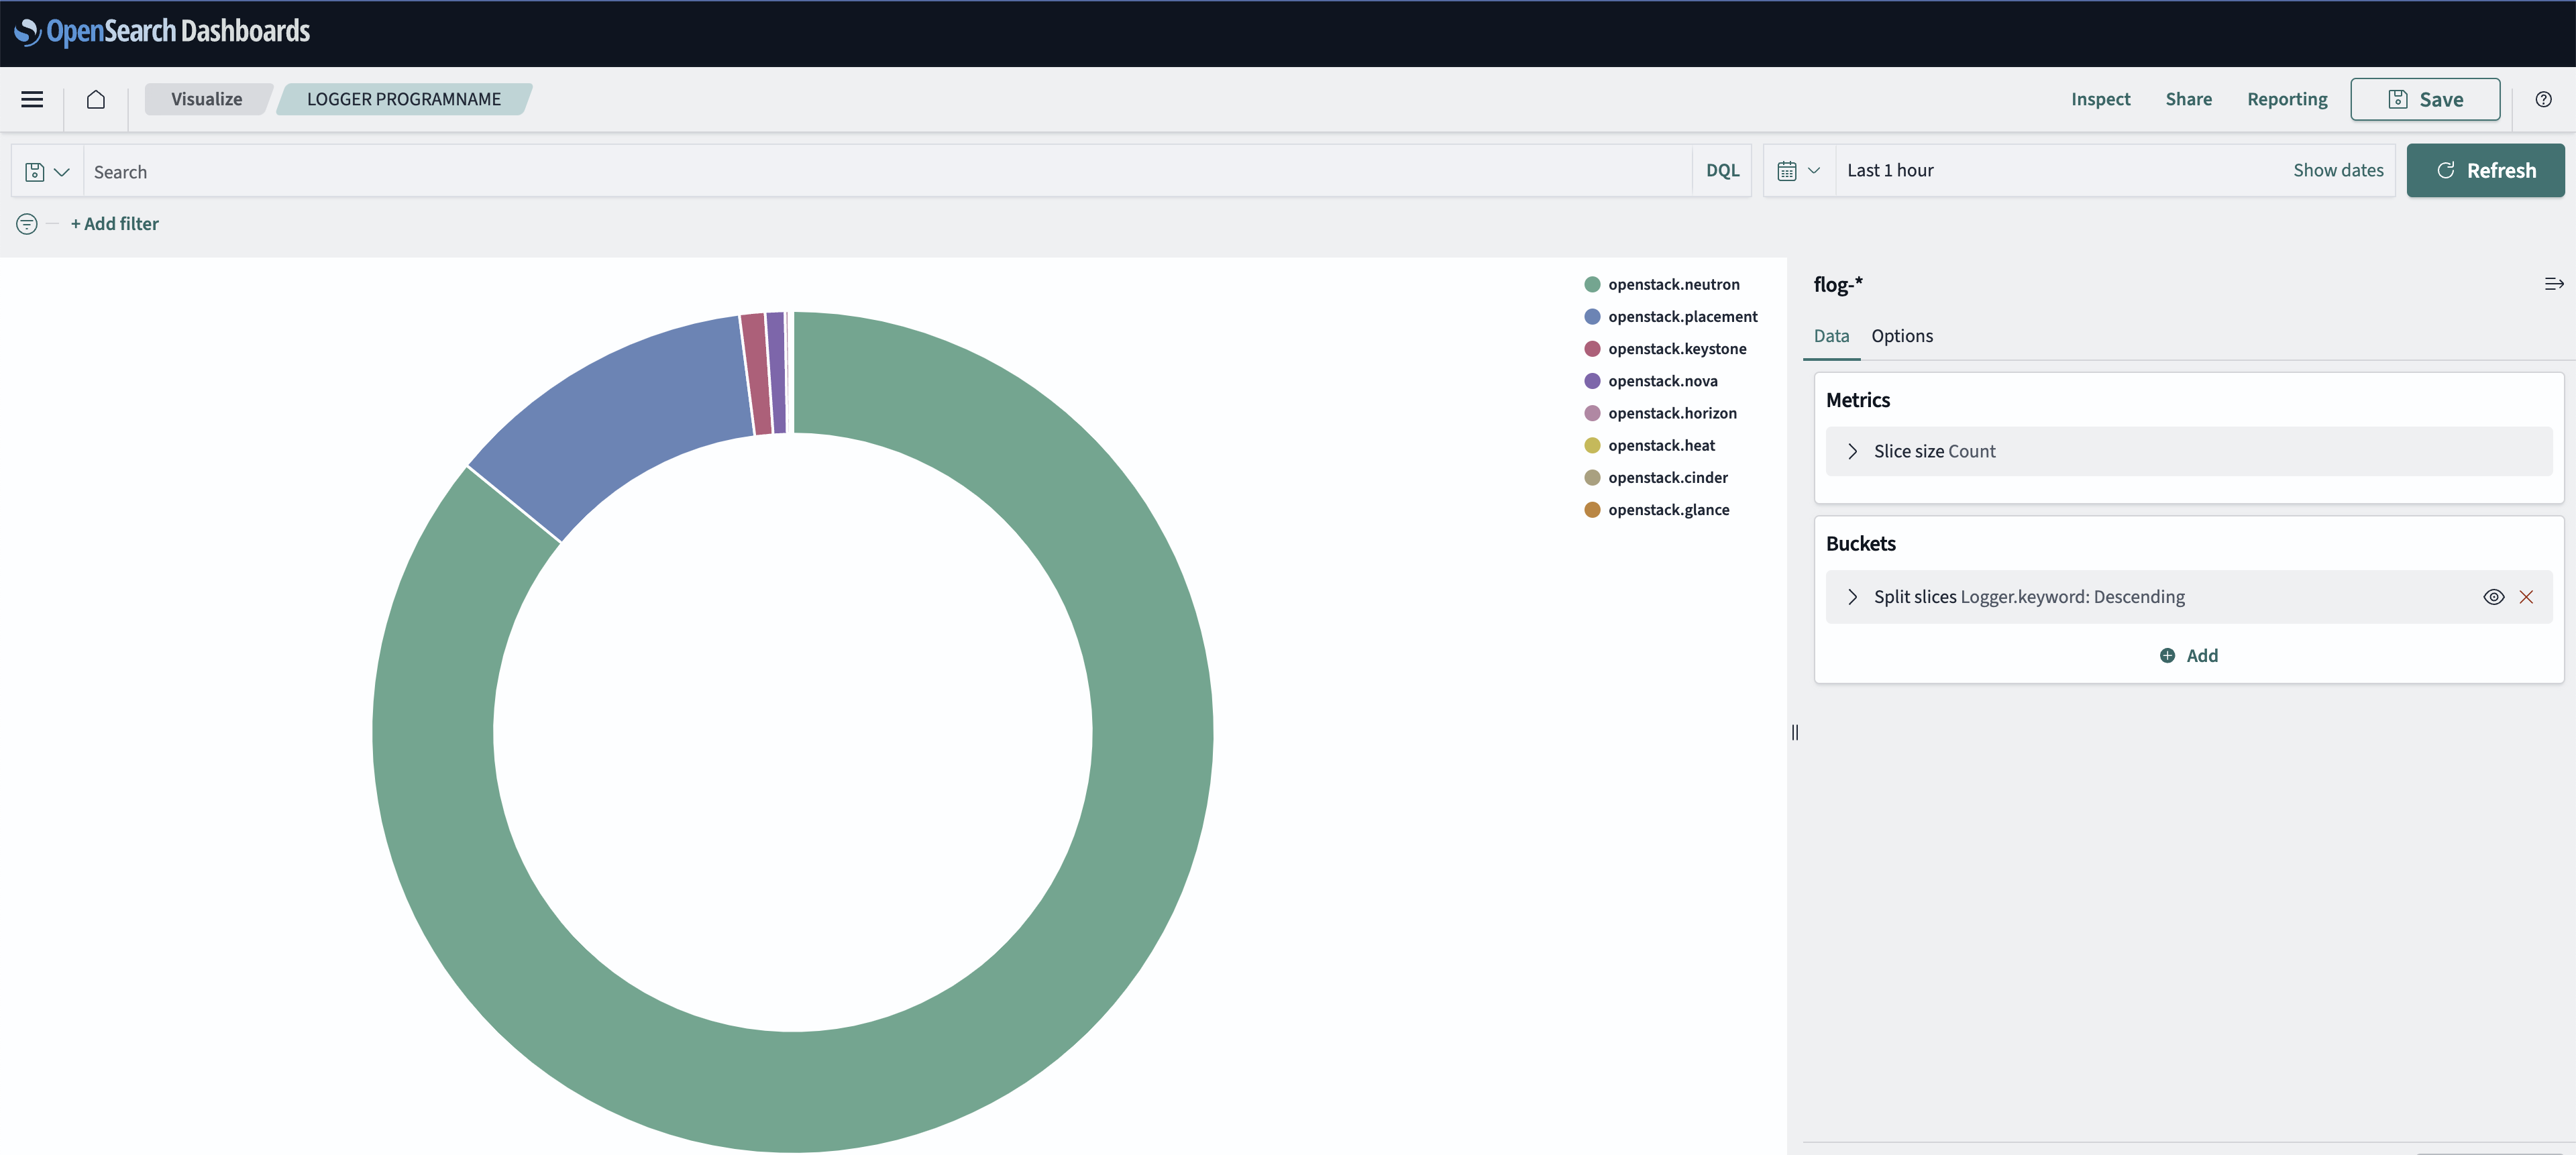
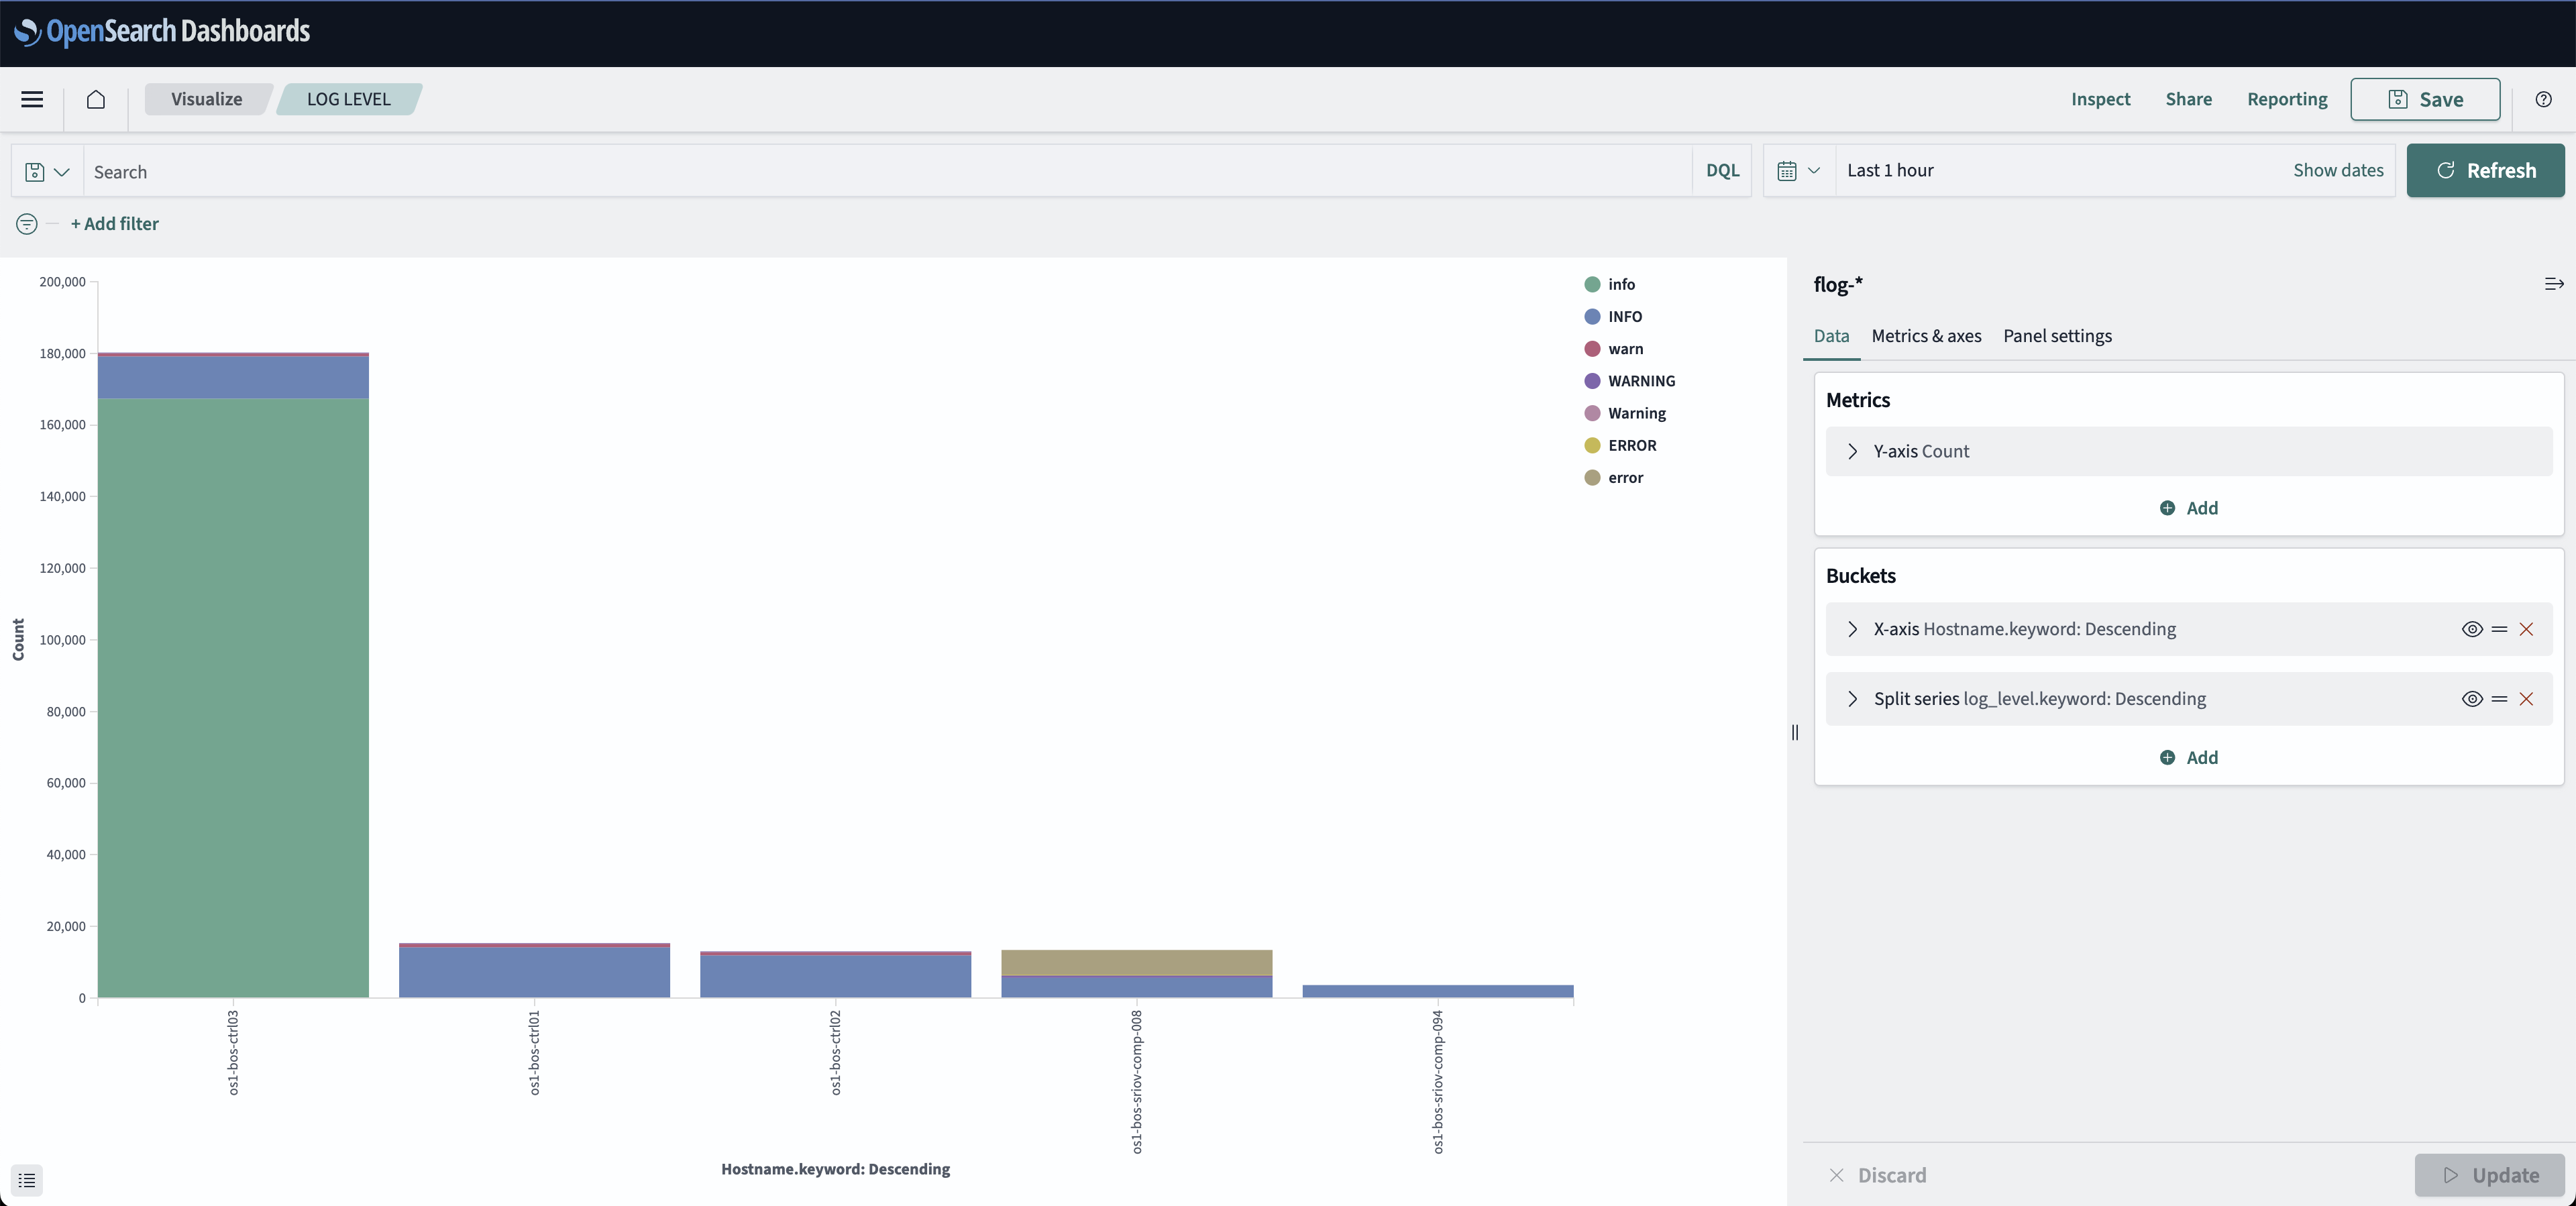
In Visualize tab you can create nice charts/graphs based on logs patterns just like following examples.
Dashboard
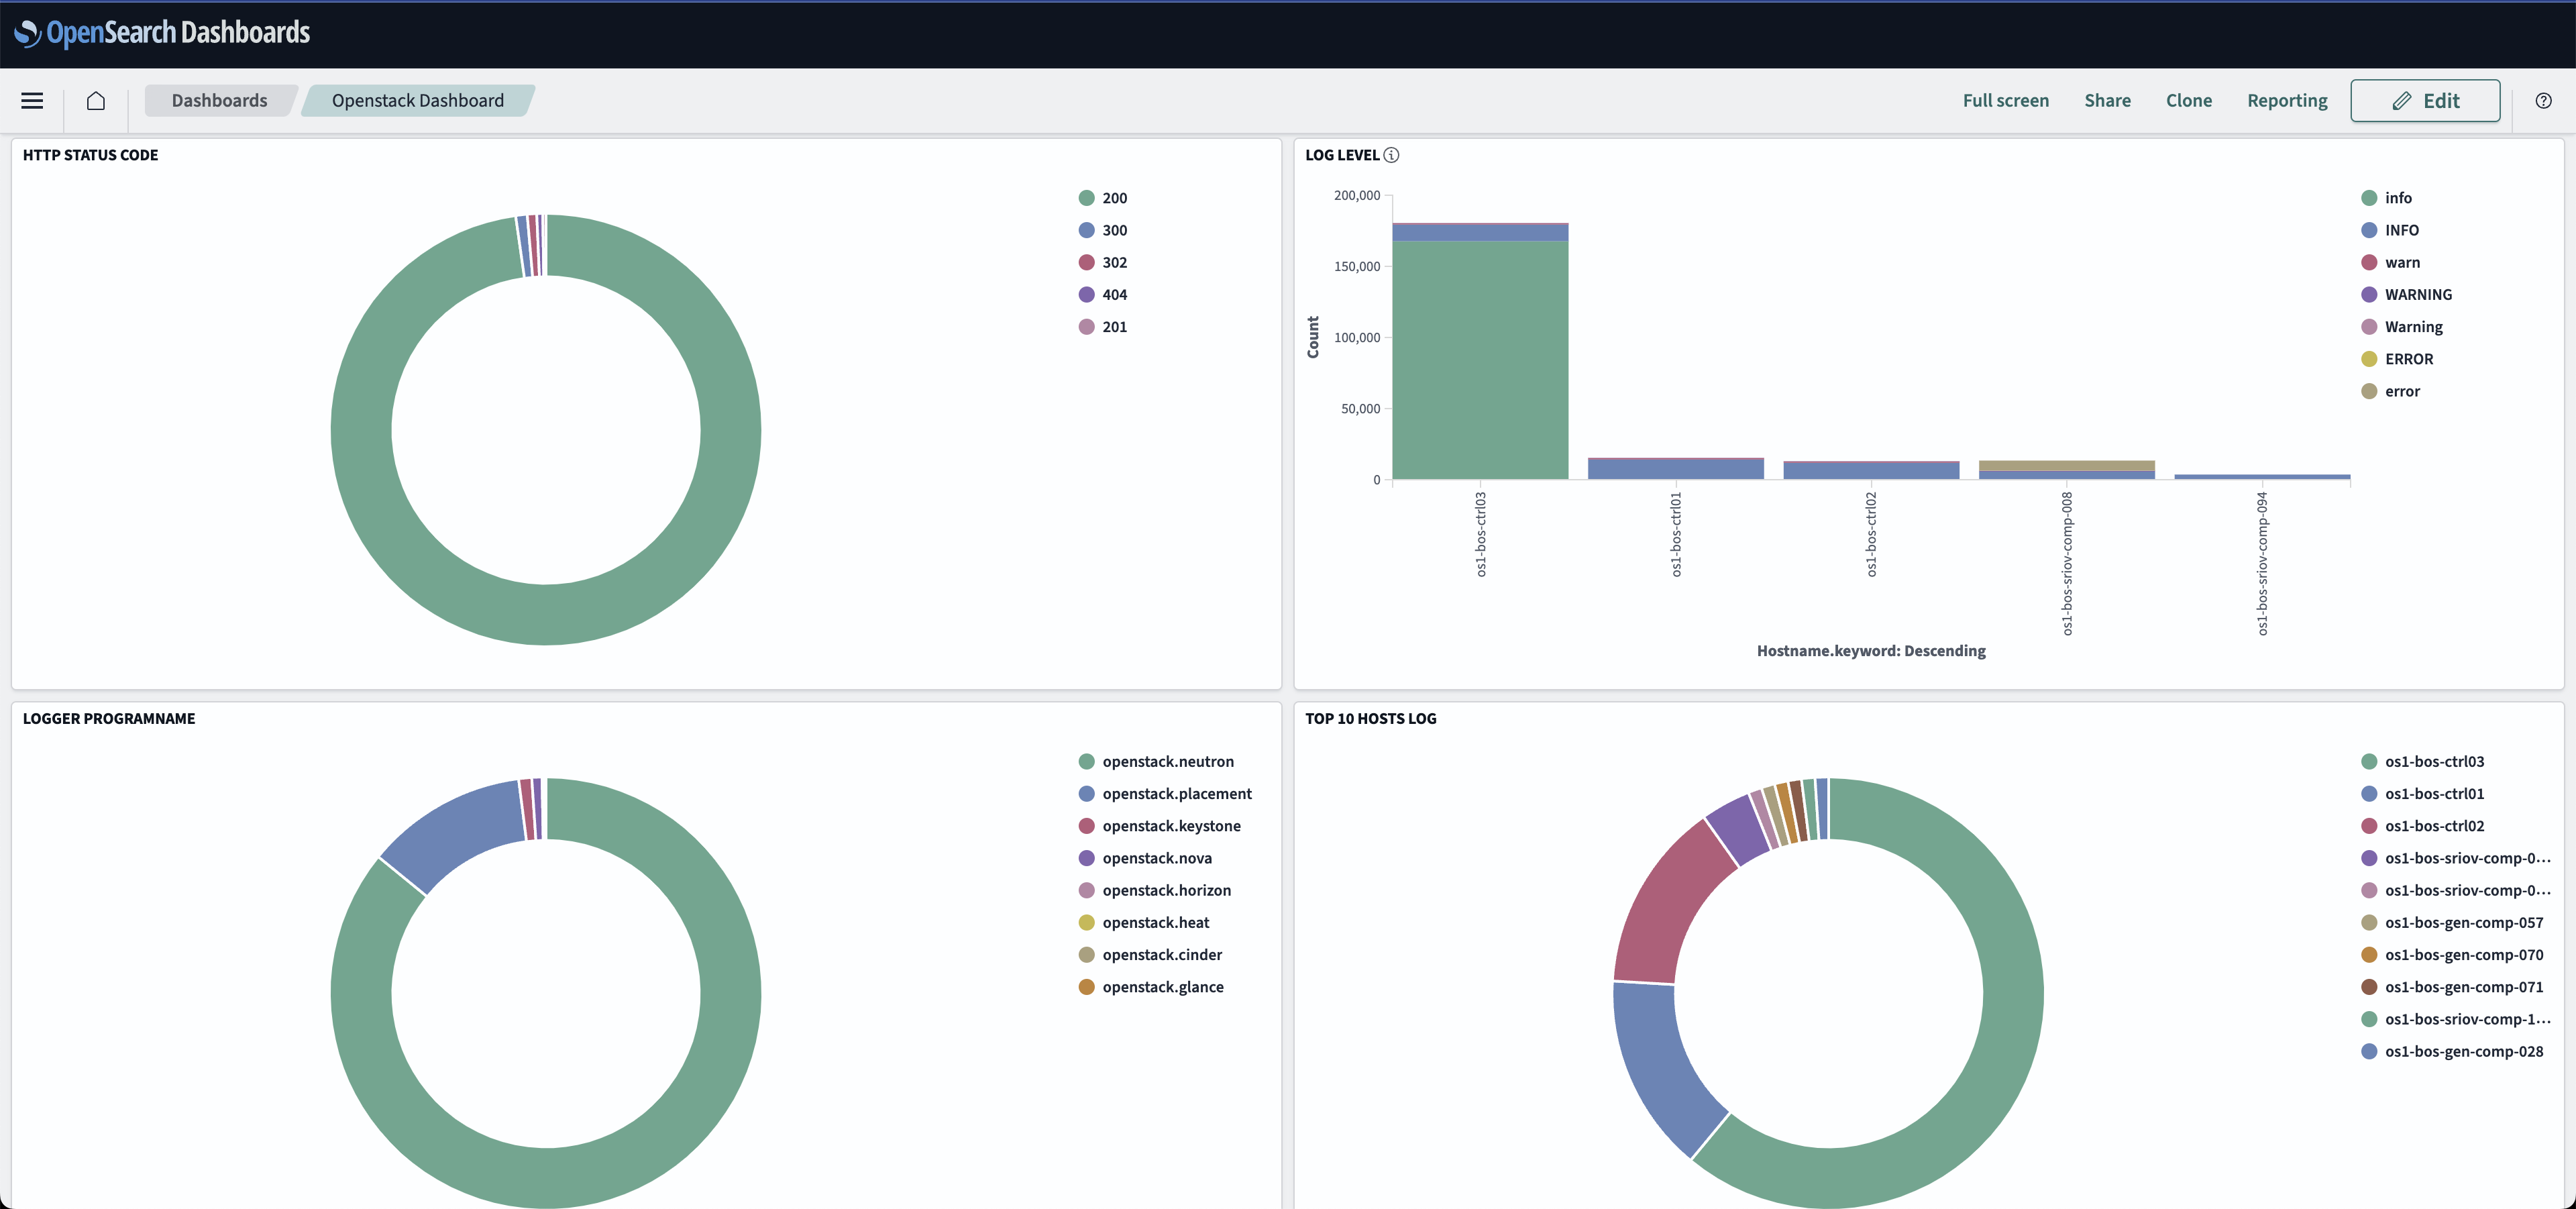
Create regular dashboard instead of observability dashboard which use PPL query language.

After creating dashboad you can add all existing visualization to your dashboard.
Enjoy!!!